|
|
BIOL
4120
Principles of Ecology
Phil Ganter
320
Harned Hall
963-5782
|
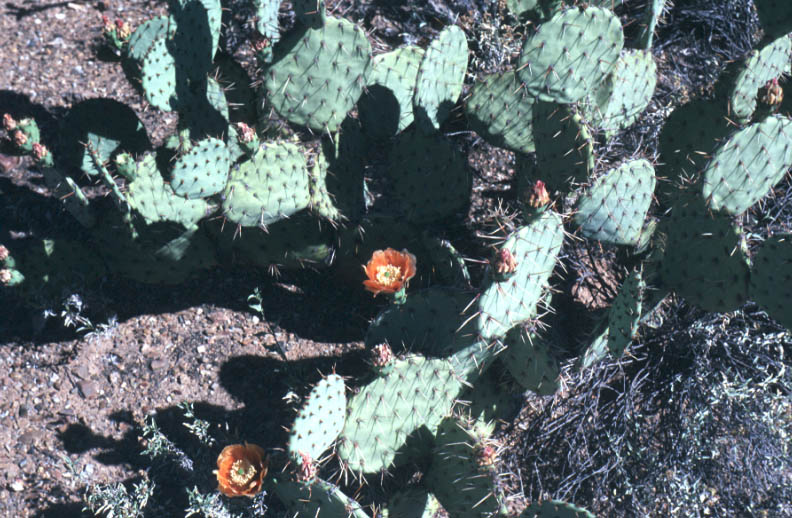
Some
populations of the cactus above reproduce sexually and disperse
when birds eat the seeds. Other populations reproduce asexually
and disperse as joints (stem sections) stick to animals. |
Lecture 9 Populations
Email me
Back to:
Overview - Link
to Course
Objectives
Populations
and Individuals
Populations are local groups of
organisms, all of the same species, in which organisms interact. These
interactions (like mating, competing for the same food or territory, communicating,
transmitting disease, etc.) are important because they help determine the dynamics
of the group (=population)
The book points out that we must
look at populations from our human perspective but must see them from the perspective
of the organisms composing them. An example of this comes from asking
how to count the members of a population. This is a straightforward question
from our perspective. Each individual is a separate organism and each
organism is a separate individual. What about a plant that grows separate
stems from a single root system? (These stems can be as small as grass stems
or as large as oak tree trunks.) This problem is not unique to plants
(consider a population of bacteria that is a mix of clones of genetically identical
individuals or a reef with many coral heads, each consisting of many individuals
budded from a single founder). Botanists have come up with some terms
that apply to this situation:
- Modular
Growth - growth by vegetative budding of new individuals genetically
identical to the original individual. Each new individual is a module.
In plants and animals, the module is usually connected to the module that
produced it, although separation can happen secondarily. In animals, genetically
identical individuals are often called Clones.
Clone also refers to genetically identical microbes (bacteria, protists, microalgae,
and yeast) produced by asexual (mitotic in eukaryotes) cell reproduction.
- Modular growth leads to two different
sorts of individuals:
- Genet
- an individual that develops from a zygote and is, therefore, a product
of sexual reproduction
- Ramet
- an individual that develops from a genet or another ramet and is a product
of asexual reproduction
Assessing the size of a population with modular
growth is often not a simple count of ramets. For some purposes, you might
need to consider genets, not ramets and counting ramets and genets together
will give you misleading results. In some cases, it is impossible to separate
ramets from one another. In such cases, the total weight of the species
(its Biomass) is assessed.
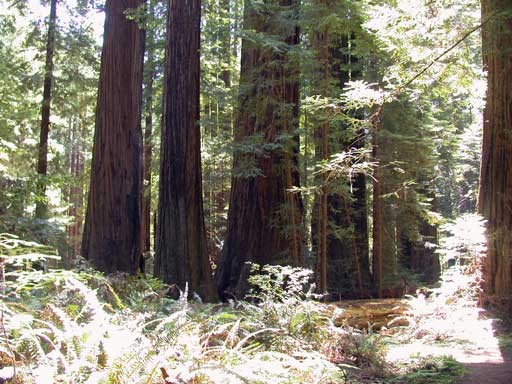
The above picture is a spectacular
example of modular growth
- the circle of trees are redwoods that have all
sprouted from an original tree, which has subsequently died and left the ring
of trees behind
- the sprouts are all over 200 feet tall
Defining
Ecology
Our operational definition of ecology
is the study of the distribution and abundance of organisms. The population
is a unit of biological organization and we can gain much insight into ecology
by examining distribution and abundance at the population level. Neither
aspect of ecology is as simple as one might expect.
The first complication is the problem
of Spatial Scale (the size of
area examined). For a species of small annual plant found throughout all
of North America, one can examine the entire range, the distribution within
a region (say, within the watershed of a river), or the plants that occur in
a single field. It is often difficult to define the edge of a population
and different important processes may operate at different scales. Mating
may be very local if, for instance, the pollinator of the plant does not leave
the field. Dispersal of the plant may involve longer distances if birds
eat the fruit and fly from field to field depositing seeds.
Distribution
Distribution
is the spatial location of organisms in a population. There are two
areas to consider in describing distribution: the boundary and patterns
within the boundary.
Geographic
Range - the outer limit of the location of members of the
population, the boundary beyond which no members are located. This is
often what is presented as distribution and can vary from the size of a field
to the size of a continent.
- The boundary may be set by
Edaphic Conditions (physical
factors like climate, soil type, temperature, salinity, etc.), by geography
(a coast, a river, a mountain chain), or by biological factors (competitors,
presence of disease, predators, etc.)
Spatial
Pattern - the manner in which organisms are distributed within
the boundary of the population.
First we need to introduce a
term and to recall two terms from math.
- Population
Density is the average number of organisms per unit area.
The unit area will differ with the organism studied. It might be
per square mile when dealing with brown bears and per square meter when
dealing with spiders in a field. Usually, average density is reported
and, if one wants to know the total number of organisms, one multiplies
average density by total area. If the density of brown bears in
the Great Smoky Mountains National Park is 0.3 per square mile and the
park covers 400 square miles, there are 120 bears in the park in total.
- The Average
(or Mean) is calculated
by totaling all observations and dividing by the number of observations.
- Variance
is calculated by subtracting the mean from each observation to get the
difference between the two (the difference is often called a deviation),
squaring each deviation (never mind here about why the deviations are
squared - ask in class if you are curious), and taking the total of the
deviations. This total is then divided by the number of observations
and the final figure represents the average of the squared deviations.
Organisms can be distributed
within an area in one of three ways:
Uniform
- when organisms are distributed so that there the distance between organisms
does not vary much so that all organisms are about the average distance
apart. This yields a pattern that is grid-like.
In mathematical terms, uniform
patterns have a variance in density that is less than the average density.
Think a second about why this should be so. If uniform distributions
are grid-like (think of the points of intersection in a square grid),
then all of samples that measure the density (done by counting number
of organisms in an area of some standard size) will contain about the
same number of organisms (some error is always present) and none will
differ from the average by much. Thus, the deviations between the
actual distances and the average distance will all be small, the square
of those deviations will be small, and the variance will be small.
Random
- neither clumped or uniform. In this situation, there is no relationship
between the locations of individuals.
In mathematical terms, random
is defined as the pattern that results in the variance in distance between
organisms is equal to the average distance between organisms.
Clumped
- ramets or genets occur as clumps (areas of higher density than random
expectation) surrounded by areas where fewer than expected organisms occur,
like islands in a lake.
In mathematical terms, clumped
distributions have a variation in density that is larger than the average
distance or density. The variance is large because some of the densities
will be small when the sample comes from a location between clumps and
other sample densities will be large if they contain one or more clumps.
The mean density will be somewhere in between the large and small values.
When calculating the deviations, observations will be large or small and
the average in between, giving larger deviations than, for instance, a
uniform distribution. The squares of the deviations will be large
and the resulting variance will be large.
Knowledge of spatial pattern can
be useful to an ecologist interested in the interactions among the members
of a population under study. Different spatial patterns arise from different
causes.
Uniform distributions often indicate
that interactions among the population members is setting a minimum distance
between them. The interaction might be competition for light (one tree
doesn't want to be shaded by another), each organism is defending a territory,
Clumped distributions are common
and can result from a number of causes. If there is Heterogeneity
(also called Patchiness) in
the quality of the area within the boundary, then patches of high quality
would support a higher density of organisms and result in a clump on the high-quality
patch. Modular growth of plants can cause clumps of individuals to develop
around a single genet or ramet. Animal social groups are clumps.
Abundance
Abundance of organisms in a population
can be considered from two perspectives. Total abundance is simply the
size of the population, whether you measure it as organisms, ramets, genets,
or even biomass. However, as we have seen above, spatial pattern in
important to distribution. It can also affect the meaning of population
abundance.
- Consider a population of desert
fig trees. There are only 10 trees in 200 square miles. This
is not a large population and the density is so low that there should be
very little interaction among the trees. However, the population distribution
is clumped. There is one stream that runs through the 200 square miles
and all of the trees occur along its banks. Now, water taken by one
tree may reduce the water available to trees farther downstream.
- Many ecologists have worked
on the difference between density as an average and the real density experienced
by members of the population. In clumped situations, the usual means
of calculating density is often misleading.
- The book separates the
two ways of looking at abundance into Crude
Density and Ecological
Density. Many ecologists call the average density
simply the density and refer to the second aspect as the Crowding
experienced by the population. Clumped populations experience
more crowding. Means of calculating crowding have been devised
but we will not cover them here.
One of the basic things one should
know about a population is its size. It is rarely possible to count
or weigh all members of a population, and so one needs to take Samples
in order to predict population size. Whenever you use samples to make
predictions about the entire population, you enter the realm where statistics
rule.
The method of assessing population
size depends on the organism being studied. The most important distinction
is between those that are motile
and those that are sessile
(sedentary)
Sessile organisms are often
sampled by using Quadrat Sampling
- plots of appropriate size are set out and the number of organisms are
counted in each of them. Statistical techniques are used to estimate
the total population size from a sample of plots.
An example of a statistical
approach to abundance of motile organisms is the use of the
Lincoln-Peterson Index to estimate population size.
It is based on the idea that the proportion of marked individuals in a sample
should be the same as the proportion of marked individuals in the entire
population.
- You would make this assumption
in a heart beat.
- Suppose I told you that
the huge jar of jelly beans contained 30% lemon and 70% cherry flavored
beans. They are thoroughly mixed and I pour out 200 beans.
How many should be lemon.
- Assume the sample's proportion
of marked beans is the same as the population's proportion of marked
beans. The sample is the 200 beans, the marked beans are the
lemon beans, and the beans in the jar are the population. Then
30% of the sample should be lemon, or 60 beans out of 200 should be
lemon.
- Lincoln-Peterson reverses
the logic.
- If you mark 50 individuals,
let them return to the population and mix thoroughly, and take a sample
that contains 300 individuals and 2 of the 300 are marked, you can
predict the populations size.
- The proportion of marked
individuals in the sample (2/300) should be the same as the proportion
of marked individuals in the population.
- You marked 50 individuals,
which is the numerator, and the population size is the denominator
(50/PopSize). So, 2/300 must be the same ratio as 50/PopSize.
Fifty is 25 times greater than 2 and so PopSize must be 25 times greater
than 300. The population size is 7,500.
Remember, 7500 is a prediction
made from a sample, not an actual count of the population size. The
methods of prediction can get much more complicated to improve the accuracy
(Lincoln-Peterson is not very accurate) and can allow a more dynamic look
at population size as organisms die, migrate, or age. We will see some
of these methods in the laboratory sessions.
Population
Characteristics related to Abundance
We have seen that abundance is a
more complicated phenomenon when examined in depth. There are other characteristics
of populations to consider that are related to abundance.
Age
Structure
Organisms are born (or germinate)
and age until death. Age structure is the distribution of members of
the population according to their age. We usually calculate it as a
proportion of the total population in each age class. We use classes
because age is a continuous variable but we usually divide age into classes
of equal length. Sometimes the classes are not of equal length.
For insects, the age classes are often life cycle stages (egg, larva, pupa,
adult).
Different age structures can lead
to very different predictions about the fate of a population. A population
composed of individuals too old to reproduce is a population fated for extinction
unless younger individuals are added through migration.
One means of depicting age structure
is to make a horizontal histogram so that the ages stack up from youngest
to oldest. From this, one can quickly assess some of the history of
the population and some of its future. A wide pyramid is characteristic
of a growing population (lots of young). A tower is characteristic of
a stationary or declining population (few young). Events that affected
one or two age classes can be seen (after WWII, age distributions in some
European countries were missing most military age men and this could be seen
even as this age class aged into retirement)
Sex
Ratio
The ratio of males to females
in a population has great consequence.
Only females produce new offspring
and so the number of females sets the limit to the growth rate of the population.
However, the genetic makeup of each generation comes half from the females
and half from the males. Compare the potential growth in a population
with 50 females and 50 males compared to a population with 90 females and
10 males. Assuming that the 10 males can fertilize all of the eggs produced
by the 90 females, the second population can produce many more offspring.
However, half of the genes in each population come from the males, whether
it is from the 50 in the first population or the 10 in the second.
Optimizing the sex ratio is a
complicated business and has lead to an entire body of mathematical theory,
Sex Ratio Theory. We will deal with some aspects of it in subsequent
lectures.
Dispersal
Dispersal
- the movement of organisms - is another of those things that becomes more complicated
under close examination.
- Dispersal can refer to local
movements within a population that can affect the spatial pattern of a population.
- Dispersal can also refer to movement
between populations. Some ecologists try to call this sort of dispersal
Migration but the distinction
is often not made. It can be useful as migration has directional offshoots,
Emigration and Immigration,
but dispersal has no such convenient terms.
Dispersal is a time of stress and
danger for organisms.
All organisms have a dispersal phase
as part of their life history.
These two statements might seem
to be incompatible. Why move if one is endangering oneself in doing
so? The fact that all organisms do must mean that the consequences of
not moving are even more dire.
If one assumes that all things
change, then any area occupied by an organism will, at some point, undergo
fluctuation is some important characteristic. It may be a flood due
to a local storm, the arrival of a disease with an immigrant, the arrival
of a predator, or the exhaustion of non-renewable resources. If all
of your offspring are in the same patch with you when things go bad, your
lineage is extinct. Dispersal may increase the mortality of you offspring
but it also avoids the ultimate loss.
Dispersal phases can be any portion
of the life history. In animals, adults may disperse (birds) or juveniles
may disperse (larvae of animals attached to rocks, like mussels and barnacles).
In plants, seeds often have special adaptations for dispersal (wings to aid
wind dispersal, fruits to encourage animal dispersal). Even microbes must
disperse. Some microbes produce special cells that can better withstand
the rigors of dispersal (Spores and Cysts) and some form relationships with
animals that disperse the microbes.
Populations are usually not stand-alone
entities. Most populations exchange migrants with other populations.
This interconnectedness of populations means that one can view a set of interconnected
populations as a Metapopulation.
When we are referring to a metapopulation, those populations that compose the
metapopulation are called Subpopulations.
This can be confusing if you think
that the term subpopulation refers to a division of a population. It
doesn't. It refers to a division of a metapopulation. Each subpopulation
is what we have been calling a population.
Terms
Modular Growth, Clone, Genet, Ramet, Biomass,
Spatial Scale, Distribution, Geographic Range, Edaphic Conditions, Spatial
Pattern, Population Density, Average, Mean, Variance, Uniform, Random, Clumped,
Heterogeneity, Patchiness, Crude Density, Ecological Density, Crowding, Samples,
Motile, Sessile, Quadrat Sampling, Lincoln-Peterson Index, Age structure,
Sex Ratio, Dispersal, Migration, Emigration, Immigration, Metapopulation,
Subpopulations
Last updated February 3, 2007