|
BIO 412
Principles of Ecology
Phil Ganter
320 Harned Hall
963-5782
|
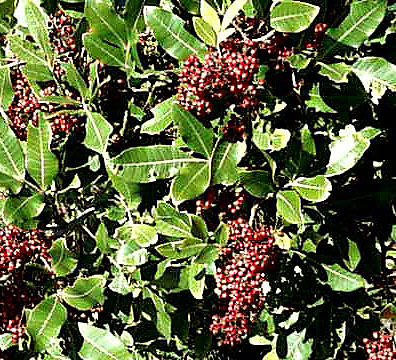
| Brazilian Pepper - an invasive
species in southern Florida, common along roadsides, that
seems to outcompete native species. The mechanism by
which the pepper does so is not known. |
Lab 2 Plant Competition
Email me
Back
to:
Introduction:
One of the ways in
which organisms may interact is competition. In this lab, we will
investigate the interaction between seedling plants. We use
plants for practical reasons. The primary advantage is that the
growth of plants is very plastic. This means that the size a
plant reaches is largely determined by environmental factors
within the general framework set by its genes (peas will not grow
into trees, no matter how advantageous the environment). Factors
that are possibly important include such things as nutrients,
light, soil characteristics (other than nutrients) moisture, and
the density of other plants (both plants of the same species and
other species). The focus of this lab will be on neighboring
plant density as a factor affecting plant growth.
We will grow plants
in two ways in order to detect the effects of competition with
other plants. We will grow an herb, sweet basil, by itself but at
different densities (number of plants per pot) and measure the
size of the plants that result. Since competition affects
individuals, we will concentrate on the effect of competition on
the average size of basil plants. We would have to do other
experiments to understand the effect intraspecific competition
has on basil populations. Second, we will look at the relative
strength of interspecific versus intraspecific competition by
growing two different species of plants, zinnia and marigold, in
pots with different densities of plants per pot. We will also
vary the proportion of each species in the pots, as some will be
mostly zinnia and some mostly marigold. Once again, WE WILL BE
INTERESTED IN THE INDIVIDUAL PLANT'S RESPONSE, MEASURED AS THE
AVERAGE SIZE OF PLANTS IN A POT (FOR EACH SPECIES)
Intraspecfic
Competition:
Questions of interest:
Other things
being equal, does the presence of other plants from the same
species affect the growth of individual plants in a
predictable fashion?
Hypothesis:
You will have
to fill this in with a reasonable guess based on what you
know about plants and the procedures described below. BE SURE
THAT YOU STATE A HYPOTHESIS AS PART OF YOUR LAB WRITE-UP. I
will need to read it in order to be sure you understand what
the lab is all about. This step should be done WITH CARE.
Starting Procedure:
- Obtain a set
of six pots. Put an inch or two of tape on each pot as a
label and label each pot with the number and type of
seeds to be planted in each plus something to identify
them as your pots. Use pencil as the pots will be sprayed
regularly with water and left in sunlight. Ink can fade
and wash away but the pencil marks should persist.
- Fill each pot
with soil until the soil comes to within 1 cm of the top.
DO NOT TAMP THE SOIL DOWN, AS YOU CAN PREVENT THE SEEDS
FROM SUCCESSFULLY GERMINATING. To settle the soil, you
can tap the bottom of the pot on the table a couple of
times.
- Plant either
2, 3, 5, 10, 18, or 34 basil seeds in each pot. After
germination, the plant populations pots will be thinned
to 1, 2, 4, 8, 16, 32, or 64 plants per pot. The extra
seeds are to ensure we have enough plants in each pot. Do
your best to space them evenly over the top of the soil.
- Top the seeds
with more soil. Completely fill each pot with soil by
gently dropping soil from your hand. (use a straightedge
or piece of paper to level the top of the soil with the
top of the pot). Once again, no tamping (tapping is OK).
- Return the
pots to the flats. The plants will be watered and tended
for the next several weeks.
Interspecific
Competition:
Questions of interest:
Other things
being equal, does the presence of other plants from other
species affect the growth of individual plants differently
than the presence of plants from the same species and does
this difference occur in a predictable fashion?
Hypothesis:
You will have
to fill this in with a reasonable guess based on what you
know about plants and the procedures described below. BE SURE
THAT YOU STATE A HYPOTHESIS AS PART OF YOUR LAB WRITE-UP. I
will need to read it in order to be sure you understand what
the lab is all about. This step should be done WITH CARE.
Starting Procedure:
- Obtain a set
of 4 pots. Put an inch or two of tape on each pot as a
label and label each pot with the number and type of
seeds to be planted in each plus something to identify
them as your pots.
- Fill each pot
with soil until the soil comes to within 1 cm of the top.
DO NOT TAMP THE SOIL DOWN, AS YOU CAN PREVENT THE SEEDS
FROM SUCCESSFULLY GERMINATING. To settle the soil, you
can tap the bottom of the pot on the table a couple of
times.
- We will use
marigold and zinnia for this portion of the lab. Plant
the seeds in the densities of:
- 4
M : 4 Z
- 4
M : 32 Z
- 32
M : 4 Z
- 32
M : 32 Z.
Do your
best to space them evenly on the soil. Notice that each
species experiences high and low amounts of interspecific
and interspecific competition
- Top the seeds
with more soil. Completely fill each pot with soil by
gently dropping soil from your hand. (use a straightedge
or piece of paper to level the top of the soil with the
top of the pot). Once again, no tamping (tapping is OK).
- Return the
pots to the flats. The plants will be watered and tended
for the next several weeks.
Gathering
the Data:
In
gathering the data from the intraspecific competition experiment,
you gather detailed information from each pot (number of plants,
weights of plants, number of leaves, length of stem). In the
interspecific experiment, all you do is count the number of
plants of each species and then take the total weight of all
plants in each pot.
You
must weigh the plants quickly, as they will lose weight,
due to water loss, as soon as you remove them from the soil. They
can lose so much water that you can completely change the outcome
of the work. So, work as a team. To gather the
interspecific data, each team member should clip the plants from
a pot and immediately weigh the plants. In the interspecific
experiment, one person should clip the plants from a pot as
another tallies the species each belongs to and separates the
plants into piles of different species and then immediately
weighs the plants from that pot as soon as they are done clipping
and tallying (the tendency in previous labs was to clip all pots,
separate the plants and then weigh them all at once, but this
takes too much time.
Intraspecific
Competition:
- Count and
record the number of plants in a pot and the number of
leaves on each plant in the pot. Record the number of
plants that produced a flower bud (if any have done so in
the time we have for this exercise).
- Cut off all
shoots at ground level.
- Weigh all of
the plants from a pot together. Calculate the average
weight by dividing this total by the actual number of
plants in the pot (not the number of seeds you planted).
- Remove the
buds and leaves from each plant stem (by pot once
again!), combine them on one weighing pan, and weight
them together to obtain the total leaf, bud, and stem
weight in each pot. Don't worry if there are no buds.
Notice that you don't have to weigh the stems, as you can
get their weight by subtracting the leaf and bud total
(or just the leaf total if there are no buds) from the
total plant weight for the pot.
- Measure the
length of each stem.
- Return the
pots to the flats.
- Designate a
member of the group who will enter the data onto a
spreadsheet and email the results to the instructor by
noon of the following day.
Interspecific
Competition:
- Cut off all
shoots from a single pot at ground level and hand them to
another student who will divide them into separate
species. Record the number of each that germinated.
- We will again
ignore the below-ground portion of the plant, as we have
no reliable way to separate the roots by species and it
is impossible to separate complete plants without tearing
apart the root ball.
- Weigh all of
the plants from each species and divide by the total
number of plants of that species in that pot to get a
mean plant weight for each species in each pot.
- Designate a
member of the group who will enter the data onto a
spreadsheet and email the results to the instructor by
noon of the following day.
Data
Analysis: You must do the sections beginning with "To get an
A ...," or your maximum score will be B+
Intraspecific
Competition: Please answer the following questions with graphs
and tables constructed from both your data and the data from
the rest of the class.
- You can look
at the effects of intraspecific competition in several
ways. The graphs, charts and calculations suggested below
are intended to do just that. first you should plot the
mean plant size versus density of plants in the pot and
do a second plot of total plant biomass in the pot verss
plant density in the pot:
- How
does competition affect the mean weight of plants
in a pot?
- What
is the relationship between total biomass and
density? Compare this to the mean weights. Does
total weight tell you anything about
intraspecific competition?
- Plot the
average stem length versus number of plants in the
pot(include standard deviation error bars).
- What
does this plot tell you about intraspecific
compeition?
- Do plants
change the proportion of biomass allocated to leaf, shoot
and root as density increases? Since the number of plants
in a pot was not strictly controlled, we can not make a
sensible bar chart. Use a scatter plot of density versus
the three proportions (stem, leaf, and bud) and examine
the graph to draw your conclusions.
- How
does density affect the proportional allocation
of biomass to the various parts of the
above-ground portion of the plant?
- To get
and A, you must do the following analysis. A
long time ago, Kira et al. (1953) proposed that the
relationship between mean plant
weight and density could be described as:
w = K p-a
where w =
mean plant weight and p = density. K and a are constants
used to fit this relationship to different plants and
must be estimated from the data. We can do this, but must
first linearize the relationship by taking the log of
both sides:
log(w) = log(K) - a log(p)
This
equation is in the form of y = mx + b, the standard
linear equation (the slope is negative here), If you plot
this, with your y values = log(w) and your x values =
log(p), the points should form a line. You will, of
course, not get a perfect line, but you can estimate the
real relationship by estimating the line. Your
spreadsheet program will do this estimation for you if
you ask for a linear trend line (be sure to get the
equation for the line). Use the equation to get your
estimates of a and K. Use a and K to get estimated mean
plant sizes for your densities. Add the expected data to
the graph of mean plant wt. versus density as a second
variable (you may want to add more densities to get a
smooth line). How does the expected line agree
with the observed data?
Interspecific
Competition:
There are many
possible ways to analyze the data from this portion of the lab.
You want to see how the average size of a plant changes as its
neighbors are more and more from another species. One of the most
visually interpretable methods was devised by De Wit (De Wit,
1961; Harper, 1967). The diagrams are called De Wit replacement
plots and are easy to make. Make a separate graph for each
species. Plot the average plant weight for each
density (total density here is approximately 10, 55, and 100
plants). There should be two points at the intermediate density,
one for the 5:50 pot and one for the 50:5 pot. Notice that this
assumes that all of the seeds have germinated, an unlikely
occurrence. Your plot will likely have different densities and,
on the X axis, you should plot the total number of plants you
actually measured, not the number of seeds planted. In the
example below, dotted lines indicate the interspecific effect and
solid lines the intraspecific effect (THIS IS NOT SO EASY TO SEE
SO BE SURE THAT YOU UNDERSTAND WHY THIS IS SO). Look hard at the
graph below and read the interpretation of in underneath.
The solid line from
the dot at 20 plants per pot to the dot labeled 100M:10Z
represents the change in marigold size when the number of
marigold seeds go from 10 to 100 while the number of clover seeds
remains constant at 10. So, the solid line is one estimate of the
effect of interspecific competition on marigold.
The dotted line above it is just the opposite. Here, it is the
marigold plants that are constant at 10 in each and the zinnia
goes from 10 to 100 plants in the pot. So the dotted line
represents the interspecific effect of zinnia on
marigold seedling weight. In this diagram, the average weight of
Marigold plants is reduced more by being in a pot with 110 plants
if 100 of them are marigolds than if 100 of them are zinnias. I
can see this because the slope of the intraspecific
(solid) line is more negative than the slope of interspecific
(dotted) line. Remember what slope means. The second set of lines
(from 100:10 to 200) will give you the same conclusion. Plot your
data and draw conclusions from what happened in your pots (this
is hypothetical here).
What you
must do, from the two graphs from your data, is to draw a
conclusion about which has a greater effect interspecific
competition or intraspecific competition? Of course, your
conclusion must be reasonably argued FROM THE DATA.
Thinking
about the experiment:
- What is the
most likely mechanism by which one plant affects its
neighbors in the intraspecific experiment? Mechanism here
refers to the actual way in which plants affect one
another's growth. There are many possibilities and
explain why you made your choice.
- Is the
mechanism of interaction likely to be the same in both
the intra- and interspecific experiments?
- Design an
experiment to test your idea from Question #1. Describe
it in enough detail to show that you have drawn on what
you have learned in other classes in order to develop
this experiment.
- Is the
mechanism you have chosen an instance of exploitation
competition or one of interference competition? Whichever
you choose, describe a possible mechanism of interaction
that belongs to the opposite type of competition.
Classic
References:
Black, J. N.
1960. An assessment of the role of planting density in
competition between the red clover (Trifolium pradense
L.) and lucerne (Medicago sativa L.) in the
early vegetative stage. Oikos 11:26-42.
Clements, F.
E., J. E. Weaver, and H. C. Hansen. 1929. Plant
Competition. Carnigie Institute, Washington, D. C.
de Wit, C. T.
1961. Space relationship within populations of one or more
species. Society of Experimental Biology Symposium
15:314-329.
Harper, J. L.
1967. A Darwinian approach to plant ecology. Journal of
Ecology 55:247-270.
Kira, T., H.
Ogawa, and N. Sakazaki. 1953. Intraspecific competition among
higher plants. I. Competition-yield-density interrelationship
in regularly dispersed populations. Journal of the
Polytechnic Institute of Osaka City University D 4:1-16.
Link to
dataset if a greenhouse disaster occurs:
Plant Competition
Lab Dataset
Materials
(startup week in bold):
Sweet
Basil, Zinnia and Marigold Seeds, Pots (11 x #of groups),
Straight edges, Soil, Paper Tape,
Scissors or razors, Balances, Rulers, Buckets, Soil
Storage Container
Last updated January 21, 2003