|
BIOL
4160
Evolution
Phil Ganter
301 Harned Hall
963-5782 |
|
07 - Evolution of the Phenotype
Email me
Link
to a list of Specific
Objectives for lectures
Back
to:
Phenotypic Evolution
- The previous lecture presented
a model of natural selection that was genetically explicit but only looked
at a
single
locus or two linked loci
- Most phenotypic traits (and all complex phenotypic
traits) are polygenic (affected by many loci)
- Here we will look at understanding evolution
from the perspective of the phenotype without knowing what the exact genetic
system that produces it
- Phenotypic traits are often Quantitative traits in that they are described
by measurement of some continuous variable, such as weight or length or
concentration or by counting something like bristle number on Drosophila
- Darwin examined many cases of artificial selection
and concluded that there was sufficient genetic variation in natural populations
to allow selection for many complex traits that would modify the phenotype
so much as to take it outside of the observed range in phenotypes found
in the natural population
- This must mean that, assuming no mutation
(reasonable in the time span of the average artificial selection
program), that these
striking phenotype changes are mostly the result of recombination
of already existing genes
- Phenotypic Variation
- Geographical Variation is an important component
of within-species variation
- Local populations may have adapted to specific
local conditions not found in locales occupied by other populations of
a single species
A Model of Phenotype
and Phenotypic Variation
- Each trait that can be measured or counted has
a mean value in a population
- With respect to a single locus that affects
whatever trait under consideration, each homozygote has a separate mean
- If the mean of the heterozygotes is at the midpoint
between the two homozygote means, then the effect of each allele at that
locus is Additive
- Let a = the distance between any homozygote mean
and the midpoint (so a is half of the interval between the two homozygote
means)
- As the value of the heterozygote departs from
the midpoint, the effect of the alleles becomes less and less linear (which
means it is less and less additive)
- Dominance is a departure
from additivity
- For some very non-linear traits, the homozygote
lies outside the interval between the two homozygote means
- A model of additive effects (we will not deal
with the more complicated case of non-additive (non-linear) effects here
- Additive effects allows us to make some predictions
about the relationship between parents and offspring
- The expected average for a trait among
all of the offspring from two parents is the average (= midpoint
because there are two parents to average) of the parent's trait values
- Natural Selection will change this expectation
(the offspring average will be closer to the favored allele's homozygote
average)
- The difference between the midpoint of the parents
and the offspring average is the Response to Selection
- The offspring should be at the midpoint and selection
is the reason for the difference
- If more than one locus affects the value
of a trait in an additive fashion, then
the
average
value
for
that trait for a particular multi-locus genotype is the sum of the
additive values of each locus of the genotype
- Recall (from lecture 03) that the variation in
a trait within a population or species can be divided into two additive
portions:
Phenotypic
Variation (Vp) =Genetic
Variation (VG) + Environmental
Variation(VE)
- Variation is the average
of the squared differences between individual values and a mean value
(the
numerator of the equation is called a "sum of squares corrected for the
mean" or more simply and usual the "sum of squares")
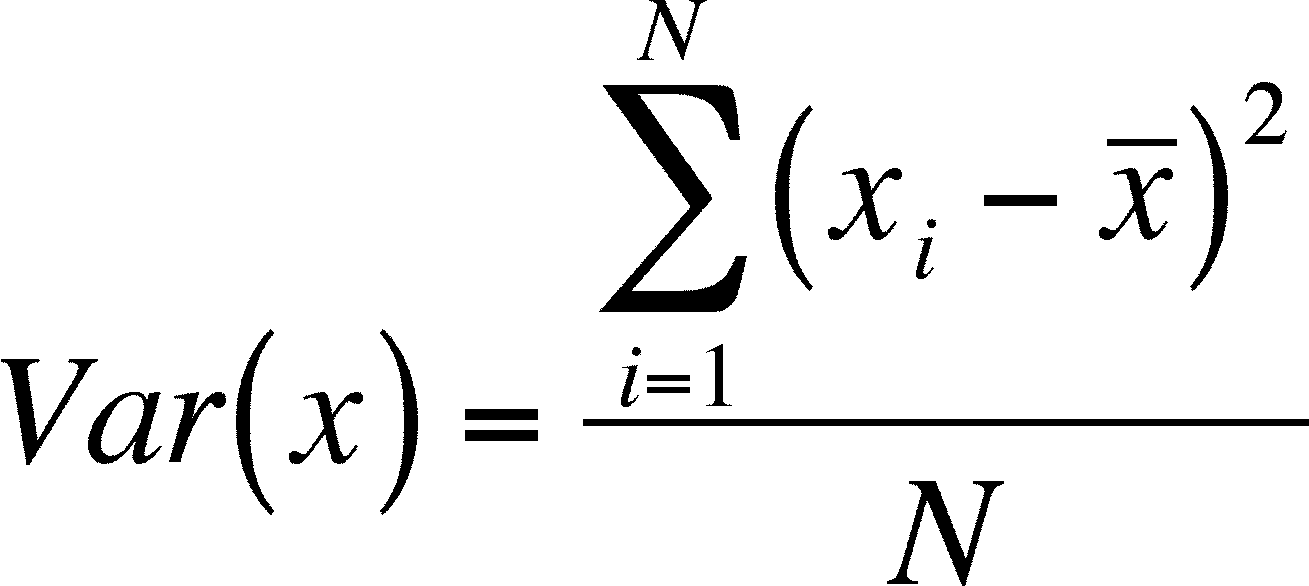
- If you have learned this
formula in a stat class, you might be expecting N-1 in the denominator,
but that is not needed here as we are describing the population and
not a sample
- Remember, variance is a
measure of the differences between all of the individuals in a population
and their collective mean - as they cluster closer to the mean, variance
shrinks (if they were all the same as the mean, then there is no variation
and variance is zero because the sum of squares becomes zero)
- The additive portion of genetic
variation due to a single locus (with two alleles) at the level of a population
(VA)
depends on the effect of the alleles (a) and the frequency
of the alleles (p for A1 and q for A2) as follows:
VA =
2pqa2
- Thus, we have a simple way to
calculate VA
- As in the case of the expected
trait values above, when more than one locus affects the value of a trait
in an additive fashion, then VA is the sum of the variance of
the trait at each locus
- Narrow-Sense Heritability --
The partition of additive variance into environmental and genetic components
allows
the estimation of heritability (in the narrow, or additive,
sense) as
h2N =
VA / (VG + VE)
- Narrow sense heritability
can also be estimated by plotting the offspring average versus the midpoint
of the parents
- The slope of the
regression line is equal to the narrow-sense heritability of that trait
Estimating the number
of loci affecting a trait
- Current methods allow the detection of loci for
which there is variation present
- Done by associating variation in the phenotype
inherited with previously identified and mapped marker loci, one can separate
the effects of each variable locus that affects the trait
- When the marker loci are recombined, so to will
be the loci closely linked to the marker
- By observing individuals that are recombinant
with respect to the marker loci, one can infer that the additive phenotypic
changes are due to recombination of loci linked to the markers
- Markers used to be rare mutations that affected
the phenotype strongly but now they can be small base-pair sequences for
which their position along the gene may be determined
- This produces a map of the genome and each variable
locus detected is detected because it is linked to a different place on
the map
- Accuracy depends
on how finely the genome is mapped
- Loci not closely linked to markers will be missed
- When more than one locus is linked to a marker,
only one will be counted
- This technique (which is both experimentally
and computationally intense) is used to identify the number and location
of Quantitative Trait Loci (QTL) for some important phenotypic trait
- often used by agronomists seeking to improve
complex traits of crops (like fruit size or flavor)
Neutral Loci
- In the book, there is a long discussion of neutrality
and phenotypic evolution, which may strike you as odd if you consider neutral
mutations to be mutations that do not affect the phenotype but this is
not completely accurate
- neutral mutations are those that do not affect
the fitness of the organism in which they occur
- mutations that do not change the phenotype in
any way must be neutral
- mutations that do change the phenotype in
some measurable way but do not affect the organism's fitness are also
neutral
- Also, many researchers in this area have
worked with "nearly neutral" mutations, one that have selection coefficients
so small and population sizes so small that random chance is a greater
influence
on their fates (fixation or elimination) than is selection
- Genetic drift and mutation will cause trait
averages to change slightly from generation to generation in a random
manner
- This means that, each generation change can be in either direction, so that
the mean seems to wander
- The rate of wandering is directly
linked to the mutation rate
- Here, selection can be detected as a departure
from the expected rate of neutral change
- Greater rates of change indicate directional or diversifying selection
- Lower rates indicate stabilizing selection
- Studies
that have looked at changes in trait values and compared them to the
expected rate
of change
due to neutral
mutations
and
genetic
drift have found many more cases of reduced rates of change than of
higher than or equal to rates of change
- Conclusion: stabilizing selection is
very common, neutral drift and other
modes of selection are less common
Correlated Evolution
- Change in one phenotypic trait may be linked
to change in another trait - this is Correlated Evolution of Phenotypic
Traits
- There are two generally recognized reasons for
this correlated response:
Correlated Selection
- Correlated Selection comes from a functional
connection between the two traits
- If the nature of one trait determines the fitness
of the other trait, then their correlation is due to correlated selection
- Consider a species of beetle that is polymorphic
with respect to size and coloration of its elytra (the hard coverings over
its wings) and is subject to intense predation
- The two most successful strategies for avoiding
predation are to avoid detection or to be able to startle the predator
by rapidly moving the elytra
- Large beetles with bright elytra are most
effective at startling the predator
- Small beetles with dull elytra are hardest for
the predator to detect
- Small beetles with bright elytra or large beetles
with dull elytra are not particularly good at either strategy
- In this scenario, selection for increased size
(for some reason other than predation) will also increase the fitness of
bright elytra and the correlation is due to correlated selection
Genetic Correlation
When organisms are observed, one can often measure
correlation between two phenotypic traits
- These Phenotypic Correlations may be due to either
- Environmental Correlation - the traits are correlated
because of some similarity in their environments (both the growth rate
and viability of infants will improve as the quality of their diet improves)
- Genetic Correlation -
the traits are correlated due to some aspect of their genotype
- Linkage disequilibrium - alleles at different
loci occur together more often than expected and, when one allele is favored
as the phenotype it affects is selected, then the other allele will also
increase and so change the value of the phenotype it affects
- Pleiotropic Effects - one allele affects more
than one trait
- Artificial selection has demonstrated
that pleiotropy is common
- Often occurs when a single locus is selected
by crop scientists - the trait of
interest
is
changed
as expected but there are other effects (often negative) on other important
traits
- As fruits get larger, trees grow more slowly
or are less disease resistant or produce less pollen, etc.
- Modifier Alleles - these are alleles at loci
other than the locus under selection that modify the selected locus' pleiotropic
effects
- The action of modifier alleles can be seen when
selection for one trait causes negative effects (on fitness) of other traits
- Note - the total effect on fitness is the sum
of the positive effect due to selection of the first trait minus the negative
effects on the other traits and the sum must be positive for selection
to drive the changes
- Any changes due to selection
at other loci that affect those traits negatively affected
and that ameliorate the negative
effects are due to changes at modifier loci
- Genetic correlation, if strong, may result in
neither trait reaching its optimal phenotype if there is a trade-off when
increasing fitness
- Book's example of egg size versus egg number
has been demonstrated for many invertebrates
- Genetic correlation may also speed the rate of
adaptation if, through linkage or pleiotropy, when adaptation of one trait
enhances the rate of adaptation at a correlated trait
Norms of Reaction
- Phenotypic Plasticity is the ability of a single
genotype to produce multiple phenotypes
- A single genotype may produce different phenotypes
that are linked to changes in the environment
- The set of phenotypes that a single genotype
can produce is it's Norm of Reaction
- Different genotypes can have different reaction
norms
- When the differences between genotypes are additive
(like the differences between parallel lines are additive because the lines
only differ in the value of their intercepts), then there is no interaction
between genotype and environment
- When genotypes change in non-additive
ways, then the interaction is important, so reaction norm plots
are ways of demonstrating
the nature of G x E interactions
- Development and Reaction Norms
- The phenotype of an organism may be set by the environment in which it
developed
- Multivoltine insects (those with multiple generations per year)
in temperate climates may have different developmental pathways
for producing spring/summer
phenotypes versus fall/winter phenotypes
- Developmental Switches are molecular mechanisms
that are sensitive to environmental conditions and direct the developmental
pathway toward one of the possible phenotypes that constitute the reaction
norm of a particular genotype
- Canalization
- Many traits are not altered much by environmental
effects and some are little changed by genotype
- The general term for the processes that influence
development such that the phenotype is not altered by environment or genotype
is Canalization
- This idea is tied to genetic correlation
in that sets of alleles are selected for if they produce the
optimal phenotype
- Phenotypic Integration is the idea that functionally
connected phenotypes should be genetically correlated so that canalization
is achieved
Last updated February 26, 2009