|
BIOL 3110
Biostatistics Phil Ganter 301 Harned Hall 963-5782 |
|
Eyespot on the wing of a Polyphemus moth |
|
|
BIOL 3110
Biostatistics Phil Ganter 301 Harned Hall 963-5782 |
|
Eyespot on the wing of a Polyphemus moth |
|
Odds and Ends
Lecture 13 - things not in text
Back to:
Unit Organization
Testing for a difference between variances (s2)
There are two situations in which a comparison of two variances might be in order
Situation A - comparing an observed variance to an expected (= known) variance
- this situation may arise when a well known procedure is changed and you want to know if the change has made a difference in the variability of the process
- in manufacturing, it is often important that variation be such that some critical value is rarely exceeded and so the variation of a procedure is critical to consistent success in production
Situation B - comparing two observed variances (neither of which is calculated or known from prior experience)
Situation A
- Using the s![]() 2-square
distribution
2-square
distribution
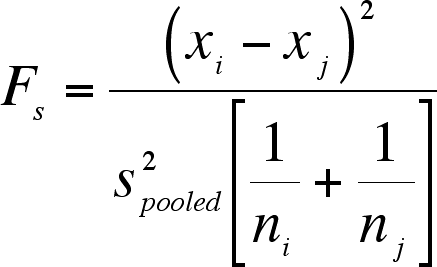
The Chi-square distribution can be used to construct a confidence interval for a variance or standard deviation or to test the hypothesis that a sample variance does not differ from an expected or known variance.
Confidence interval for a sample variance
Procedure:
- First you have to find the
2 values for the right and left side of the confidence interval.
- Since the
- This is best seen through an example - say a 95% confidence interval
- you want to divide the
- the Samuels and Witmer table will only give you values for right tail probabilities up to 20%, so you can't get your left side
- you can use the Chisquare function in MSExcel or go to the web or come to me to get the left side
- Degrees of Freedom = n -1 (n is the sample size)
- Now that you have the
- you can get the confidence interval for the standard deviation by taking the square root of the two confidence interval limits
Hypothesis test of the difference between a sample variance and a known variance
This situation arises when you have a sample and can calculate a sample variance and you want to compare this value with a known variance to see if they are really different or if the difference is just due to sampling error
there are two ways you might know the value of a variance - theory or experience
- there is an expected variance based on a formula derived from statistical theory - expected, here, means that you can calculate what you expect the variance to be
- you have experience with data of the sort found in the sample and you feel that the historical variance is accurate (this is equivalent to accepting the variation published in the literature as the "true and accurate" variance)
There are three alternative hypotheses, each with its own variation of the test
- the first two situations are one-tailed situations for alternative hypotheses that the sample variance is larger than the known variance or that the sample variance is smaller than the known variance
- H0 : s2 =
2 HA : s2 >
- H0 : s2 =
- H0 : s2 =
- the third situation is the two tailed test (the alternative hypothesis is simply that the two variances are not equal)
Once again (see the confidence interval above), the
Procedure:
- First you have to find the
- We will use an alpha-level of 0.05 for here as an example, but any alpha-level can be used, of course
- For all three, the degrees of freedom are n - 1 (n = sample size)
- if HA : s2 >
- if HA : s2 >
- if HA : s2 >
- calculate the
- evaluate the statistic
- if HA : s2 >
- if HA : s2 <
- if HA : s2 is not equal to
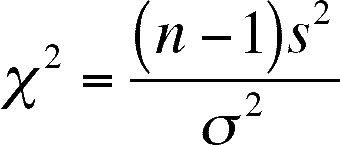
Situation B - Using the F distribution to compare two variances
We have seen the F-distribution before in the lectures on ANOVA
Consider the previous use of the F distribution.
To evaluate the effect of a factor on a response variable we used the ratio of mean squares, dividing the mean square due to the factor by the mean square due to random error
The ratio is the F statistic, which has a defined probability distribution, and we can compare our F value with a critical value that depends on a pre-defined alpha-level.
A mean square is a variance (look at the way in which it is calculated in Lecture 11a) and so we are really comparing two variances when we calclate the F statistics in an ANOVA table
In other words, we have already compared two variances when we evaluated ANOVA results. The MS/MS is from lecture 11a and the S/S is the general definition of the F statistic
So, to test for equal variances:
- put the lager of the two variances on top (a ratio below 1 can never be found to be significant)
- find the critical value
- alpha depends on your choice
- degrees of freedom for the numerator is the sample size minus 1
- degrees of freedom for the denominator is also n - 1
Two tailed or one tailed?
You will have to decide if the test is one or two tailed
- one tailed for alternative hypothesis that numerator variance is larger than denominator variance
- H0 : s21 = s22 HA : s21 > s22 - note that the one-way always has the numerator greater than the denominator
- two tailed test if the alternative hypothesis is simply that the two variances are not equal
- H0 : s21 = s22 HA : s21 is not equal to s22
- for this one, divide alpha level by 2 before looking into the tables for a critical value
To evaluate the F-statistic, you
- accept H0 if the calculated F-statistic is less than the critical value from the F table
- reject H0 if the calculated F-statistic is greater than the critical value from the F table
Remember what statistical power is -
The probability of rejecting H0 when H0 is false (i. e., when HA is true).
To test this, we need to know the distribution of ts when is HA true
Specifics of the test
![]()
and
standard deviation = 1
More post-hoc tests for differences between levels in ANOVA analysis
When there are several levels of a treatment that has been found to be significant through the AVOVA procedure, a question arises about which of the treatment level means are significantly different from the others. Consider three levels of a treatment: A, B and C. Since the treatment is significant, one would suppose that significance is reflected in the comparisons of the mean values for each level.
But how is it reflected? Is A different from B and B different from C? Could be. Are A and B not significantly different and B is not different from C but A is different from C. That situation would also result in a significant ANOVA result. How to tell? Well, since we don't know where the differences lie, the usual procedure is to examine differences between pairs of means for signifigance. This can be done systematically, perhaps by ordering the differences between means from smallest to largest and testing from one end of the series. A t-test could be used for each comparison.
A problem arises when the number of comparisons grows large, which it will do quickly. See the section below on combinations (part of enumerative combinatorics) for a hint on the derivation of the formula but the number of pairs = n*(n-1)/2. So, for 8 levles, there are 28 pairs of means to compare.
If we use an alpha level of 0.05 for each test (this alpha level is called the per-comparison alpha level (PC alpha), we are asserting that there is a 1 in 20 chance that each inference we make is wrong. This means that we expect, out of 28 inferences, 28*0.05 = 1.4 wrong inferences. We expect to make an error at the collective level (all 28 comparisons) even though we chose a per-comparison error rate (alpha level) with which we were comfortable.
So, how do we correct the situation to get back to our comfort level? How do we get to a familywise alpha level (FW alpha), this could also be called a group alpha level) that reflects the risk of making an error we want? The simplest way is known as the Bonferroni Correction of the per-comparison alpha level and it is intuitive. If we divide alpha by n and redo the calculation of the number of errors we expect to make, we get back to the original alpha. In our example, we adjust the per-comparison alpha level by dividing by n, so we get a familywise alpha level of 0.05/28. Now we can expect 28*(0.05/28) = 0.05 errors, an error rate we decided a priori is acceptable. However, this alpha level, (0.05/28 = 0.0018) means the alpha level for each pairwise difference is quite stringent and gets more so as the number of pairs increses. Alternatives exist and some are described below.
On persepctive on the use of a Bonferroni correction is to use it when you are interested in a Global Null Hypothesis. This means that you are interested in the outcome if any one of the means is different from the others. Thus, any significant pairwise difference rejects the global null hypothesis. An exaggerated example might be the situation of defusing a bomb in 20 steps. You are going to go through the defusing procedure one at a time, each with a PC alpha of 0.01. In this case, an error in any of the steps is a disaster. However, this sort of extreme situation is not usual in experimental biology and the Bonferroni is often too conservative.
![]()
The Sheffe test is useful because you can use it when sample sizes differ among treatment levels.
The Sheffé test is conservative, in that it will reject the null hypothesis less often than other tests provided here and in Lecture 11b
Duncan
Dunnett
SNK
Tukey
False Discovery Rate
The Tukey test is another pairwise, post-hoc comparison of means
http://fsweb.berry.edu/academic/education/vbissonnette/tables/posthoc.pdf
http://departments.vassar.edu/~lowry/tabs.html#q
http://cse.niaes.affrc.go.jp/miwa/probcalc/s-range/index.html
Testing for a difference between proportions
Other uses for the Chi-square distribution
We have already gone over two uses above:
We have already had a very brief introduction to probability in Lecture 3 but we will formalize some basic concepts here and introduce some new ones.
Four basic rules of probability:
1. The probability of an event, x, is expressed as a fraction between 0 and 1, inclusive
0 ≤ Pr(x) ≥ 1
2. Impossible events have a probability of 0 and certain events have a probability of 1
3. The sum of the probabilities of all possible events is 1
4. The compliment of an event (or set of events) is all other possible events (not part of the set) and the probability of the compliment of an event is 1 minus the probability of the event
Pr(compliment x) = 1 - Pr(x)
Adding Probabilities - We have (in Lecture 3) covered the way to add two mutually-exclusive events [Pr(A+B) = Pr(A) + Pr(B)] and how to add two events that are not mutually exclusive [Pr(A+B) = Pr(A) + Pr(B) - Pr(AB)].
Multiplying Probabilities - In Lecture 3, we introduced multiplying probabilities through the use of a probability tree. To use the tree, we had to assume that the two events were independent events.
What if the outcome of one event affects the probability of a second event occurring? We call these dependent events, not surprisingly, and we need a second formula for multiplying these events.
Dependence in the real world is often more subtle than this example.
So, why and how would we multiply dependent probabilities. Let's consider a situation in which dependence applies.
Suppose you have a bag of M&M candy, say 10 pieces in the bag. You are thinking of offering two friends a chance to reach in and choose a piece but are a bit worried. You like the new blue colored pieces the best and will only offer the candy if the chance of losing two of the blue is sufficiently small. If there are only 2 blues, how do we calculate the chance that both friends will take a blue (assume that neither can see the piece they are choosing) and leave you bereft of the choicest M&Ms?
- The first draw yields a chance of 2/10, or 1/5
- Given that the first draw took one of the precious blues, the chance that the second will also be a blue is 1/9.
- We had to reduce both the total number of blue pieces and the total number of pieces by 1 due to the outcome of the first draw.
- The probability of both events occurring is then 1/5 x 1/9 or 1/45. That's low enough for all but the most abject chocoholics and you would probably decide to share.
- Note that we had to adjust the second probability based on what happened during the first draw - we say the second event is conditional on the outcome of the first event.
We can formalize this idea by introducing a new wrinkle in our probability notation, Pr(B|A). The line is vertical, so it does not indicate a fraction and the expression is read "the probability of event B given that event A has occurred" or, more briefly, "the probability of B given A."
- Pr(B|A) is called the conditional probability of B given A.
- So, the multiplication of two dependent events is:
Pr (A and B) = Pr(AB) = Pr(A) x Pr(B|A)
To see if you understand, try calculating the following. Two cards are drawn from a deck and are not replaced. What is the probabilty of drawing two aces? of drawing an ace and a king, in that order? The answers are 4/52 x 3/51 or 12/2652 and 4/52 x 4/51 or 16/2652. In each case, what happened first affected the second probability
This logic can be extened to three dependent events. What is the probability of drawing three aces in three cards? An ace, then a king, then a queen? The answers here are 4/52 x 3/51 x 2/50 or 24/132,600 and 4/52 x 4/51 x 4/50 or 24/132,600.
The formulation above can be rearranged using some simple algebra.
Reading this in English produces "The probability of B given A is equal to the probability of both A and B occurring divided by the probability of A"
Why do we need this formulation?
It says that you can find the probability of some event, given another event has taken place by dividing the probability that both events take place by the probability that the original event occurs.
For example, what is the probability of eating an apple with a worm in it? I have two apple trees, one with 35 apples, of which 15 have worms, and a second tree with 24 apples, of which 12 have worms. However, the first tree is next to the house and the second is beyond the first tree. This means that you are 3 times more likely to choose an apple from the first tree. Now, we have all the info we need if we assume all of the apples on a tree are equally likely to be picked. The chance that you will pick the first tree is 3/4 and, given that, the chance you will pick one with an worm is 15/35 [in conditional terms, this is P(A1)*P(B|A1)]. The chance you will pick from the second tree is 1/4 and, given that, the chance of the apple containing a worm is 12/24 [in conditional terms, this is P(A2)*P(B|A2)]. The overall chance of getting a wormy apple is (3/4*15/35)+(1/4*12/24) = 125/280 = 44.6%.
Now we can explore an extension of conditional probability that is currently shaking the foundations of how we go about hypothesis testing in the biological sciences. The extension was discovered by an 18th century minister named Bayes and is called Bayes' Theorem
Bayes' Theorem answers the question: given event B1, which is conditional on the outcome of event A, what is the probability of event A1? We can continue with the example of the wormy apple introduced just above. Given that you have a wormy apple (this is event B1, getting an apple without a worm is B2), what is the chance it came from the second tree? Well, it's the probability of getting a wormy apple from the second tree divided by the chance of getting a wormy apple from either tree or (for our case here, with only 2 outcomes for event A, choosing a tree).
![]()
This formula can be generalized by realizing that there may be more than two possible outcomes for event A and so we have to expand the denominator for the n possible outcomes of event A:

This is Bayes Theorem and it has been around and been useful for almost 250 years. With the advent of the computer, uses for the theorem are blossoming and it is having an effect on biological methodology in the fields of phylogenetics, population genetics, genomics, proteomics, and bioinformatics. In the future, its impact may be even more profound in that it may alter the methods we use to test hypotheses throughout the biological sciences. There is a difference in viewpoint in how we assign probabilites to events. The two camps are labelled "Frequentest" and "Bayesian" but we need not further define these viewpoints here. Tradionally, the frequentest viewpoint has dominated how biologists go about testing hypotheses (our text and the lectures on this website cover frequentest methods). Recently, Bayesian methods have been developed for more and more situations normally evaluated using frequentest methods. Which methodology will be the standard? I don't know but it is not inconceivable that this website will be obsolescent or greatly modified in the near future. How likely is that? That's a question better approached using Bayesian methods - maybe a sign of the future.
Simple Enumerative Combinatorics
Combinatorics is the study of discrete objects and enumerative combinatorics is the study of the number of ways to form particular patterns from those objects. We use one of those patterns in the formula for the binomial distribution (combinations).
It is often useful to be able to calculate two kinds of subsets drawn from a larger set of objects, permutations and combinations. Initially, we will assume that, once an object has been drawn from the large set, it is not replaced and, so, can not be drawn again. This is drawing without replacement.
Imagine that you have 12 close friends, all of whom wish to come with you to a concert. You can only take three and decide to select the concert group randomly (assuming that you will be one of the concert group) and so you write your friends names on separate identical pieces of paper, put them into a box, shake the box and draw out three slips. These three slips represent a Combinaton of 3 of your 12 friends. How many combinations are there? There is a simple formula for determining this:
where C is the number of combinations, n = the total number of objects in the larger group, and r is the size of the subset. The exclamation point (!) indicates a factorial. In our case, 12C3 = 12!/(12-3)!3! = 12!/9!3! = 198 combinations of three friends drawn from a group of 12.
[Note - factorials are important to combinatorics and their properties underlie phenomena we all experience. If you play cards, you might have considered how many ways there are to order the deck. A factorial will tell us. It's 52!. Doesn't seem to big does it? Fifty-two factorial is over Eighty thousand billion, billion, billion, billion, billion, billion, billion. It's a big number. Factorials describe how information passes around the web and how everybody seems to know everything instantly.]
Sometimes, the members of the subset are not the only important information about the subset. Sometimes, the order in which they occur (or have been drawn) is also important. These subsets, where order is important, are Permutations. In the example above, you might have drawn Bob, Tom and Lee, in that order, or you might have drawn Tom, Lee and Bob, in that order. These two subsets are the same combination because both have the same three friends. They are not the same permutation because, although they have the same friends (a necessity for permutations, as well as combinations) but they the subset memebers were not drawn in the same order. If you are making sandwiches from a large set of possible ingredients at a buffet, you want the right permutation of ingredients, not the right combination. A sandwich made of bread, cheese, bologna, mustard, bread is the right permutation but it would be socially inept to try to eat a sandwich that was mustard, bread, cheese, bread, bologna, even though both sandwiches are the same combination of ingredients (each slice of bread is a separate object, so we are not sampling the same ingredient twice)
So, how many permutations of your 12 friends taken 3 at a time are there: Once again, a simple formula will determin this:
n and r are as above and P is the number of permutations. For our example, 12P3 = 12!/(12-3)! = 12!/9! = 1320 combinations of three friends drawn from a group of 12.
Remember! The formulas above assume no replacement. What if you do replace things? There are formulae for that also. Permutations of n kinds of things taken r at a time, with replacement, is described by:
nPr = nr
You have a simple combination lock, which should really be called a permutation lock, that has only the 10 digits (including 0) on each of three wheels, but have forgotten the correct combination (permutation!) to open it. How many permutations might you possibly have to try before you got the right one? P = 103 = 1000. Not so many. What if there were 6 wheels? 1,000,000. How is this replacement? Because, if the first wheel is set to 5, the second wheel can also be set to 5. In situations without replacement, once 5 is used, it can't be used again.
Notice that, since there is replacement, r can be larger than n. We can ask how many combinations of three things taken six at at time there are because each object can be chosen repeatedly. This situation cannot arise when sampling without replacement, as you can't make a group larger than the number of objects present. Examples: you like to kiss your three children. If you kiss them six times, how many combinations of kisses are there. One combination might be to kiss the youngest six times and not kiss the other two. Another possibility is that you kiss each child twice. How many combinations are there? 729! This is sampling with replacement because each child can be kissed more than once and r can be larger than n (r=6 and n=3 here). You also like to take them with you when you go to the store, but there are only two extra seats in the car. How many combinations of two children are there? 3. This is sampling without replacement because once a child is put in the car, that child can not be the next child put in the car. Now, can r exceed n in this situation? Well, r is the size of the group you are taking to the store. Can it be larger than 3? No, you can't make a gouup of four children in the car if you have only three children.
Combinations of n types of things taken r at a time with replacement are a bit more complicated, but not much. the formula is:
nPr = (n+r-1)! / r!(n-1)!
Suppose you were to try to choose a different combaination of three types of doughnut out of 9 varieties at you favorite bakery. How long would it be before you had eaten every combination? There are only 165 combinations so, if you go every day, it's less than half a year.
We will not give any other areas of combinatorics much consideration here but some of these, such as graph theory, have applications that are important in biology. One biologically significant example will have to do. A pattern is created by adding two consecutive numbers in a series together to get the next number in the series. Start with a series 0, 1 and, to get the next number, add 0 and 1 to get 1. Now the series is 0, 1, 1. The next number is 1 + 1 = 2, so the series is 0, 1, 1, 2. The next number is 1 + 2 = 3 and so on. This series would then grow as: 0, 1, 1, 2, 3, 5, 8, 13, 21, 34, 55 ... The rules and starting point for such series are flexible (start with 3, 4 or add the three previous members of the series or multiply them instead of adding) but the simplest one, described here and called the Fibonacci series, has been useful in biology in understanding things from the geometry of a snail shell to the developmenal pattern of plants. One of the reasons is that the ratio of any two Fibonacci numbers approximates the Golden Ratio (= one half of the sum of 1 plus the square root of 5) and the approximation gets better the larger the Fibonacci numbers. If you break a stick of length c into two pieces of length a and b and if the ratio of the larger piece to the total length (a/c) is the same as the ratio between the smaller and larger piece (a/b), then you have divided the stick according to the golden ratio. The golden ratio pops up in so many places that some have attributed mystical properties to it. There is a Fibonacci Society dedicated to the study of this series that has published a journal, called the Fibonacci Quarterly, since 1963. If you want more on these remarkable numbers, google either and you will get an avalanche of information.
We have previously defined and used several probability distributions: the Binomial, the Normal, the F distribution, and the Chi-square distribution. Below, we briefly introduce a few more distributions for situations not easily described using the distributions we have already introduced.
What if, instead of just two possible outcomes for each trial in the binomial, there are more than two choices. Remember that the binomial describes the probability distribution of the number of successes out of n trials, given the probability of success for any single trial. Flipping a coin is often used as an example for a binomial trial (just heads or tails) but things are often more complicated. The multinomial increases the options for the outcome of a trial.
If there are more than two possible outcomes, then the distribution must reflect the combinations of outcomes you might get in the number of trial under investigation. An example will illustrate this. Suppose a bird's diet is such that there is a 50% chance that it will eat a snail, a 30% chance that it will eat a worm, and a 20% chance that it will eat a beetle. What is the chance that the next six food items are three snails, two worms and a beetle?
If there are k possible outcomes for any one trial, then their probabilities must add to 1 (p1 + p2 + p3 + ... + pk = 1). The number of trials is n, as in the binomial, but the number of trials with each outcome must be specified. Here, we will use X1 to be the number of time outcome 1 happens, X2 the number of outcome 2 trial, etc. so that the sum of the X's must equal n (X1 + X2 + X3 + ... + Xk = n). The probability of a particular outcome is then:

This formula is a parallel to the binomial but reflects the greater number of outcomes and combination of those outcomes possible. In our case, the calculation is P(3, 2, and 1) = (6!/(3!*2!*1*))*0.53*0.32*0.21 = 60*0.125*0.09*0.2 = 0.135, or a 13.5 % chance of the next six food items being three snails, two worms and a beetle.
To get the complete distribution one must calculate the probability for all possible combinations of outcomes. We discussed how to calculate the number of combinations of n things taken r at a time in the section on enumerative combinatorics above. This is sampling with replacement, since the same outcome can occur more than once. So, the number of combinations of outcomes is nr, which is 36 or 729 in this case. So the total distribution can involve lots of calculation and can soon become impossible as both n and r increase.
Remember that the probabilities are assumed to be constant in this formula, such that, if the first trial is outcome 2, this does not change the probability that the next trial might be outcome 2. This means there must be sampling with replacement. This assumption is sometimes ignored when there is sampling without replacement when the sample size is much smaller than the population size.
For example, if you know the frequency of fish species A, B, and C in a lake, you can use the multinomial to calculate the probability of getting 30 of species A, 40 of species B, and 5 of species C. Removing a fish from the lake changes the chance that the next fish will be the same species (there is now one less to catch) but this can be ignored if there are hundreds of fish from that species in the lake since one less will not change the frequency much.
Negative Binomial
Hypergeometric
Poisson
This is the basic simulation technique used to simulate long-term real world outcomes based on immediate probabilities of outcomes.
It uses are seen most readily in the description of the Monte Carlo procedure
- determine all possible outcomes from a situation (it could be an experiment or any actual situation)
- determine the probability of each outcome (these probabilities must sum to 1)
- make a scheme that relates a range of random numbers with the probabilities of all outcomes
- if there are three outcomes with the probability of Pr(A) = 0.5, Pr(B) = 0.3, and Pr(C) = 0.2 and the random number range is 0 to 9 (integers), then any of the schemes below will work as well as any other
- A = 0, 1, 2, 3, 4 B = 5, 6, 7 C = 8, 9
- A = 2, 3, 4, 5, 6 B = 7, 8, 9 C = 0, 1
- A = 0, 2, 4, 7, 9 B = 3, 5, 8 C = 1, 6
- The important feature is that the proportion of the range of random numbers assigned to any outcome is the same as the probability that that outcome will occur
- Select random numbers (from a table or with a good random number generator on a computer - MSExcel has this function but it is not recommended for this use)
- Tally the outcome for each random number choice
- Summarize the outcomes from all choices of random numbers
This is a useful method of predicting change in a system over time where there are different states for any member of the system and known probabilities of transitioning from one state to any other state during a given period of time
- for instance, a population of animals can be healthy, sick with a disease, recovered from the disease and immune to further infection, or dead from the disease
- there are four states and you can specify probabilities for transitions between any two states
- some will be zero probabilities (no going from health to recovered or from dead to any other state)
a simulation will begin with a set of individuals, each in one of the four possible states
an iteration will take the situation as it is and move individuals from state to state based on the probabilities of transitioning from the current state to the other states (including no change of state)
successive iterations will simulate the most probable outcome for that system at some time in the future
Markov Chain Monte Carlo Simulations (MCMC Simulations)
If individuals are moved from state to state using a Monte Carlo approach, the model is refered to as an MCMC model