|
BIOL
4120 Principles of Ecology
Phil Ganter 320 Harned Hall 963-5782 |
Back to:
![]()
![]()
![]()
![]()
|
|
BIOL
4120 Principles of Ecology
Phil Ganter 320 Harned Hall 963-5782 |
Back to:
![]()
![]()
![]()
![]()
Purpose:
The book has a rather incomplete description of the simple models of population growth. This page of supplementary material's purpose is to flesh out the basic concepts. It adds to, but does not substitute for, the material in the textbook. The models discussed here are very general and make assumptions not met by many real populations. However, many models Models of population growth can become very complicated as details of a species biology and its environment are added to the model. This material is linked to the notes on population growth.
Sections:
- Discrete Generation Model
- Continuous Time
- Linking continuous and discrete models of growth
- Problems
- Literature Cited
What you should know:
You should be familiar with life tables and the demographic parameters (R0, Tc) that can be calculated using the life table.
Discrete Generation Model - Geometric Population Growth:
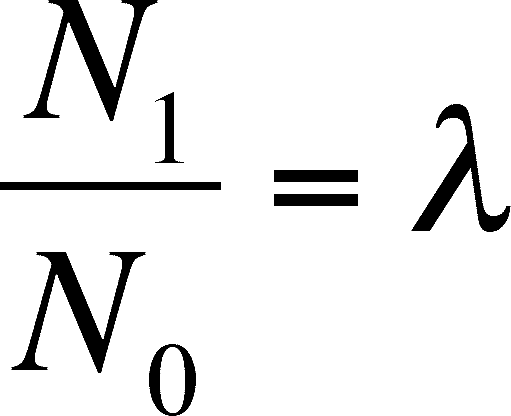
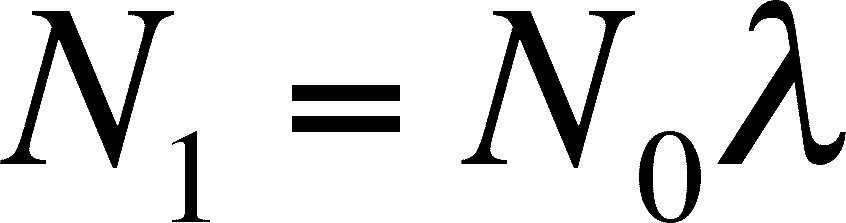
Your text presents a fundamental relationship between population growth and the net replacement rate (R0) and change in population size.
- This equation relates the number of a particular life stage or age present in generation 0 to the number expected in generation 1.
- How can you use this to predict the population size after more that one generation has passed?
- Consider the following iteration of the first equation:
N2 = N1R0
N3 = N2R0
N4 = N3R0
- Now, lets substitute for N3 in equation the last equation above:
- Now, lets substitute for N2 in the equation immediately above:
- Now, lets substitute for N1 in the equation immediately above:
What about organisms with Overlapping Generations?
We can use the discrete approach for organisms with overlapping generations. Suppose you are dealing with a large population of an organism that lives for many years and reproduces many times after reaching adult size, like a deer population. You survey the population size and age distribution each year in the late spring. We can use the equation for predicting population size in successive generations (derived above) for predicting the deer population size in successive years.
Suppose we were to measure the ratio of population sizes in one year versus the next or any unit of time we choose. In the case of the deer, a year is a reasonable unit since we survey each year. We then get the equation below by symbolizing the ratio as the greek letter lambda (l).
And a simple rearrangement give us:
This equation looks very much like the original discrete equation above. Only the units have changed.
(the Greek letter lambda) is called the finite rate of increase (or finite multiplication rate). It is the number of females alive at time T+1 per each female alive a time T. To predict the size of the population in t years, you can use an equation analogous to that in the previous section on discrete growth:
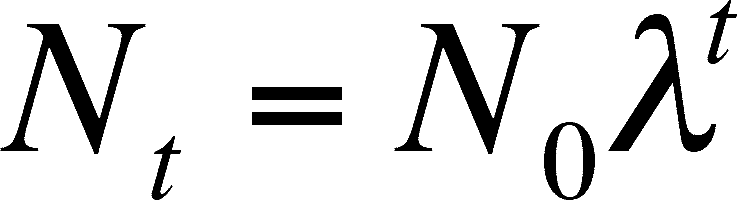
The above equation is derived in exactly the same way that the discrete equation based on generation time is derived. Remember that this is discrete growth, and will only predict the population size at discrete (or finite, which is the reason for using finite in the name of l) time intervals. If the unit is one year, then you can predict N after 1 year, 2 years, 3 years, etc. It does not predict the growth after 1.5 years.
Now, we can find the predicted number of deer 15 years in the future if we know the present deer population and . If you survey the size of the female population at 200 one spring and as 234 the next spring,
*This is the mass of the light matter only.
Obviously, we have a problem here. We need to add some reality to the projection. There are many ways to do this and we will do it by modifying the equation developed for growth in continuous, rather than discrete, time that are developed below. The modification is called the Logistic Equation and is discussed in Lecture 11 with supplemental materials at the web site Modeling Density-Dependent Growth.
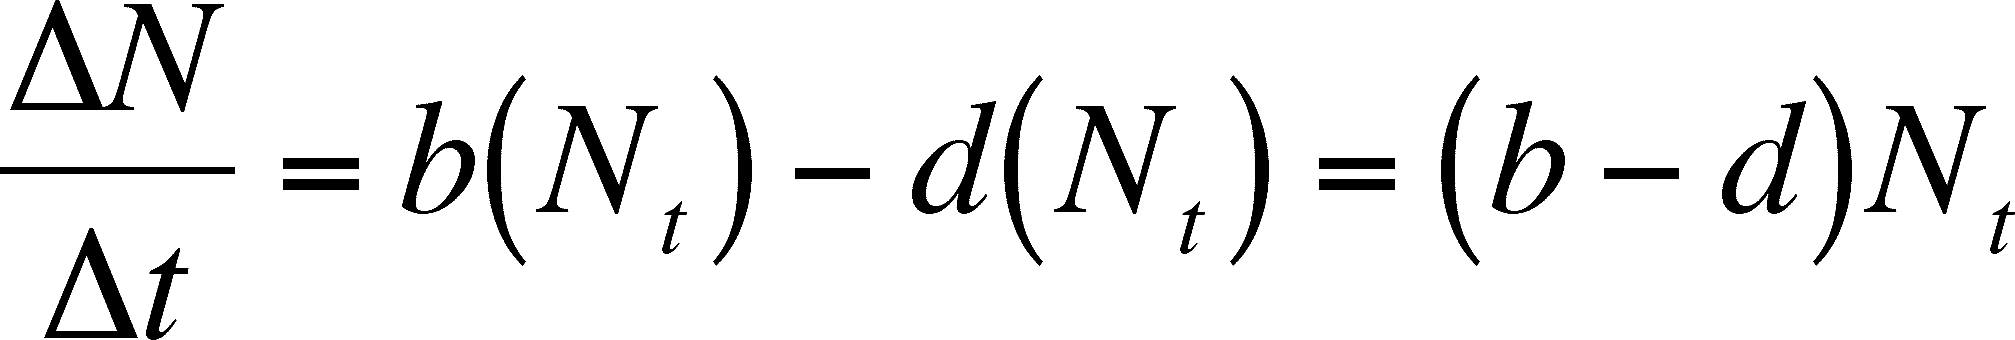
The equations above predict the population size in the future. We can also determine the rate of growth for the population. Remember that the Greek letter delta,
, is used to indicate "the change in" some variable. We start with an equation that will predict Dt, the number of individuals that die in an interval of time. This will be the product of the death rate per individual, d, the population size, Nt, and the amount of time that passes,
The same reasoning can be used to develop the equation for the number of births at the same time.
So, we can determine the size of the population at time T+1 (Nt+1) by adding the number born to and subtracting the number that died from the starting population size (Nt).
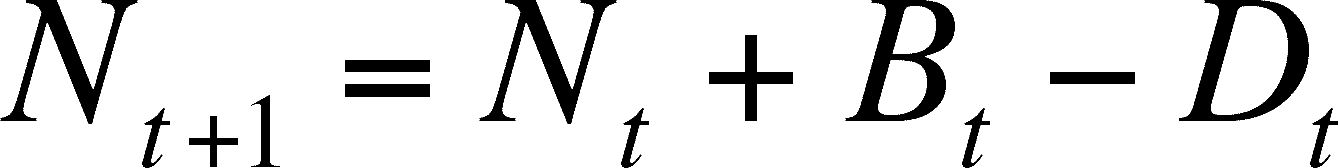
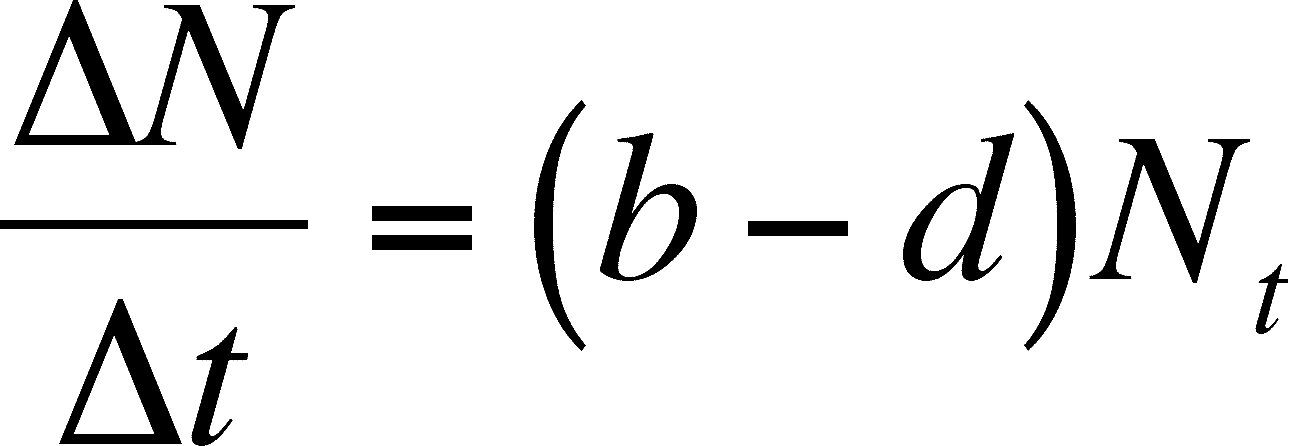
Now we need to do some substituting and some rearranging so that we can determine the rate of change of the population. First substitute for Bt and Dt.
Then we can subtract Nt from each side.
On the left side, we now have the size of the population at time t+1 minus the initial population size, which we can symbolize with its own
By dividing both sides by t, we get the following
Note that the rate depends on N, which will change over time. Thus, the rate of growth changes with time. As N increases, so does the rate of growth, even though the INDIVIDUAL birth and death rates (b and d) do not change. This merely means that more individuals produce more births and deaths in a unit of time, which makes sense. However, we are still stuck with predicting population size and growth rate at discrete intervals. We now move on to using continuous time, so we can predict both at any time in the future we choose.
Continuous Time Model - Exponential Population Growth:
When you are dealing with organisms that have overlapping generations, such that there are always births and deaths occurring in the population, a continuous approach is needed. In the discrete case, you are predicting the population size at discrete intervals in the future. For example, if you want to know the number of eggs of a univoltine insect hatching next spring, then you might predict this with the discrete model. But, the model makes predictions only in one year increments, which makes sense, as new eggs are laid only once each year.
In the continuous approach, you are not predicting the population size or growth rate at discrete intervals in the future, but at any time in the future. We will need some calculus for this, but we will approach it with a discrete equation first. Start with the finite rate of increase (from above).
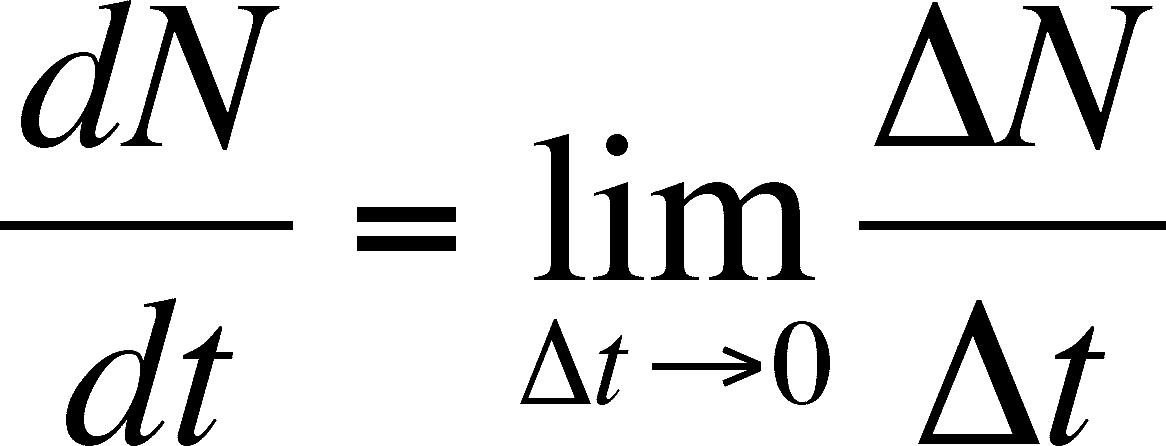
What happens as the difference in time decreases? We can make t smaller and smaller until it is almost not there and watch the change in the rate of growth of the population. The limit of this decrease is 0 (no time between t+1 and t) and we can ask what happens as we approach this limit. We cannot cover the mathematics of limits here for those who have not had a course in calculus, but we can say that the limit is symbolized as dN/dt, which is the continuous time equalivent of
Read this definition as: dN/dt is the limit of N/t as t decreases to 0. By doing this, we can now view b and d as instantaneous birth and death rates and we will assume that they are constants (as before in the discrete case) so that:
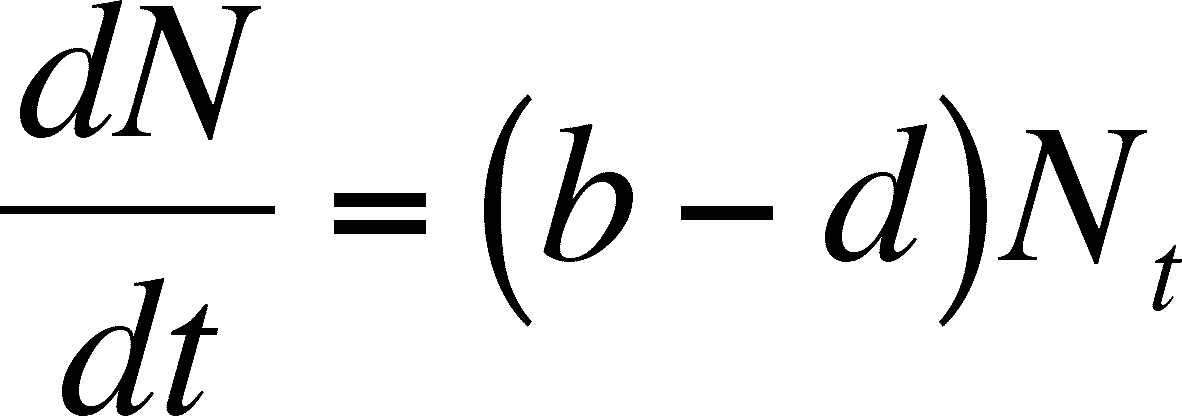
Since b and d are constants, the difference between them will be constants and we can call this difference r so that r = b - d. r is called the intrinsic rate of population growth and note that it is an INDIVIDUAL rate, just like b and d were. If we substitute r for b -d, we get the standard equation for the rate of change in an exponentially growing (or declining - r could be a negative!) population. As above in the discrete case, the rate of POPULATION growth depends on the ability of an INDIVIDUAL to grow in a give environment (r) and the size of population. Large populations will change more than small ones.
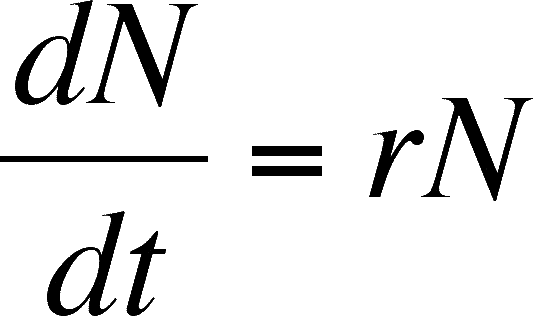
At this point, it is essential to understand what the expression above means. Much of the modeling that follows is based on varying this equation by adding more parameters. This equation does not directly predict the population size. dN/dt is a rate. If you have not seen this notation before, then think of it as the change in population size (N) over an infinitesmally short period of time (t). On a graph of population size versus tmie, dN/dt is the slope of the Tangent to the curve at any point.
The intrinsic growth rate can be positive , negative or zero, depending on b and d. What does it mean if r is positive, negative or zero? A positive value means that the population is larger at the end of the instant than at the beginning (no matter how tiny the difference is) and so the population is growing and the tangent line has a positive slope. A negative value means that the population is smaller at the end, so negative values describe declining populations and the tangent to the curve will have a negative slope. A zero means no change, so the population is stationary and the tangent line is horizontal. These values correspond to >1 (growing population), 1 (stationary population), and values 0 to <1 (declining population) for R0.
The intrinsic rate of increase of the population describes the ability of an individual to reproduce in a given, unchanging environment. It can be considered a character of that individual (this is why intrinsic is part of the name, as it depends on an intrinsic ability of the individual), and, given that all individuals of a population have the same abilities, it can be considered a character of the species. In reality, we know that individuals vary but we can ignore this variation here, as we want a general model with only the level of detail necessary for an elementary understanding of the mechanisms of population growth. Note that r is a constant in the equation and is independent of population size.
So far, we have determined the exponential rate of growth for continuous time but we have not developed the equation for predicting population size in continuous time. Start with the equation for the rate of population growth derived above.
dN/dt = rN
Collect the N terms on one side by themselves and you get:
dN/N = rdt
Integrate both sides. If you haven't had calculus, just follow along on this step.
ln(N) + c1 = rt + c2
The two c terms are constants and will be gone by the end of the procedure. In fact, we can reduce the number of constants if we put them both on one side of the equation.
ln(N) = rt + c2 - c1
We can combine the two constants into a new one by defining c as the difference between c2 and c1 (c = c2 - c1) and substituting it in the equation.
ln(N) = rt + c
Get rid of the natural log term by taking the antilog of each side.
N = e(rt+c)
Remember that adding exponents is like multiplying the terms, so we can rearrange the exponents.
N = ecert
Now, lets get rid of the last c. I credit the text for this nifty bit of algebra. Set the equation for time 0, at the start, so that we can find the starting population, N0. This makes t in the exponent equal to 0
N0 = ecer0= ece0
Now, the entire exponent is equal to 0 and anything to the 0 exponent is 1, so e0 becomes 1 and we get:
N0 = ec
Now, take the above result and substitute N0 for ec in the equation two steps above and you get:
Nt = N0ert
Notice that we have also changed N to Nt. This is just to make explicit that we are predicting the population size (N) at some future time (t) based on the current population size (N0) and the exponential growth factor, ert. This equation is the standard equation for predicting Exponential Population Growth.
Before we go any further, we should consider the assumptions made by this model. It is always important to be aware of the assumptions made by a model (and assumptions are always made, whether the model is verbal, pictorial, or mathematical). Let the above be a hint to those wishing to do well on exams. If the assumptions are not reasonable for the actual system to which you wish to apply the model, then you must either modify the model or risk the failure of the model to accurately reflect the system's behavior. The assumptions of the exponential growth equation are:
- No immigration or emigration.
- Constant b and d (therefore, constant r).
- No variation among individuals in genetics, size, or age
- No time lags
One can modify the basic equation for violation of any of these assumptions, so we have models that include various levels of detail and are tailored to specific organisms in specific environments. We will next modify this equation (and rename it the logistic equation) to account for a violation of the first assumption. In future lectures, we will modify this equation to accommodate the presence of competitors, predators, and parasites. It is this flexibility that makes this modeling approach so useful. One starts with a simple concept and builds on it in an attempt to explain more complex (and realistic) situations.
(return to Modeling Density-Dependent Growth if you have come to this page from that page)
Here is an interesting sidebar on the above equation. It can be used to predict a commonly used indicator of population growth potential: doubling time. To predict how long it would take a population to double, simply solve the equation as below
- Nt/N0 = ert
- Nt/N0 = 2
- ert = 2
- rt = ln(2)
- t = ln(2)/r
So the doubling time depends on r and will drop as r increases. The table below (from Fenchel, 1974) gives some doubling times for a range of organisms from those with very large r's to those with very slow growth rates.
Organism
r (indiv./indiv*day) Doubling Time T phage virus
300.0
3.3 min E. coli
58.7
17 min Paramecium
1.59
10.5 h Hydra
0.34
2 d Flour Beetle
0.101
7 d Rat
0.0148
47 d Cow
0.001
1.9 yr Antarctic Beech Tree
0.000075
25 yr
Linking discrete and continuous models
You can link the discrete and the continuous models if you know R0 and Tc (= the cohort generation time):
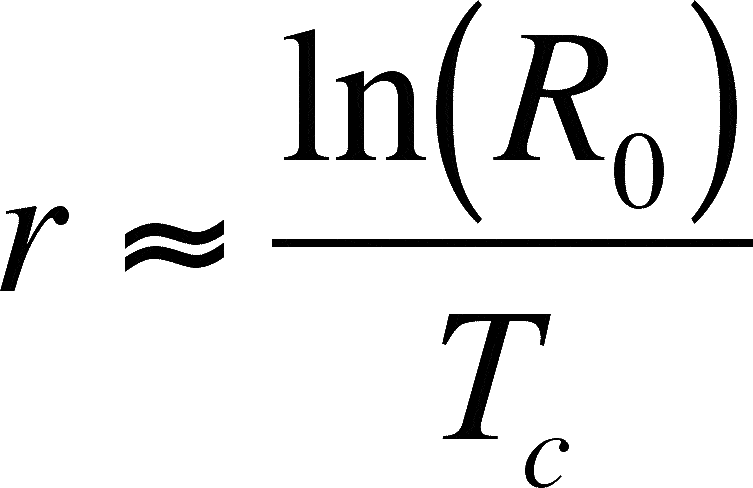
The squiggly equals sign means it is an approximation. We will accept this approximation here, but you should know that there is a way to calculate r more exactly. A life table accurately describes the schedule of births and deaths of a population and Euler's equation (not presented here) can be used to calculate r based on a life table.
Fenchel, T. 1974. Intrinsic rate of natural increase: the relationship with body size. Oecologia 14:317-326.
Last Updated on February 28, 2007